The Construction Leadership Council Smart Construction Dashboard demonstrates housing sector performance using a set of agreed KPI’s and Benchmarks. The dashboard contains maturity metrics for cost, digitisation, waste, energy, productivity (pre-manufactured value), carbon, health, safety and speed of build, and wellbeing. Since the first release of the dashboard in October 2018the sector has evolved. The UK government’s construction transformation funds has enabled housing projects to focus on future performance and innovation. Covid-19 has substantiated the requirement for an accelerated approach to deliver Smart construction. Digital technologies are gaining momentum in the sector, with leading contractors embracing and investing in advanced manufacturing and measurement. We are observing substantial progress with investment to transform the sector, such as the Urban Splash £90M deal with Sekisui, as well as TopHat receiving investment of £75M from Goldman Sachs.
In 2019 our CLC Innovation in Buildings workstream measures working group merged with the demonstrator projects and business case working group enabling the set metrics to be specified on housing projects and to demonstrate best housing practices against the UK Government’s Construction 2025 goals.
I’m pleased to announce the release of our second Housing Dashboard incorporating new data from 2019 to show the performance of the sector against the metrics. Greater guidance will be given for housing providers, developers and contractors to measure the performance on their own housing projects. We have introduced a new health and wellbeing measure, and made enhancements to the dashboard which consist of some new benchmarks, created by gathering better data sources with improved methodologies. The 2020 target is set at a 20% improvement on the benchmark target.
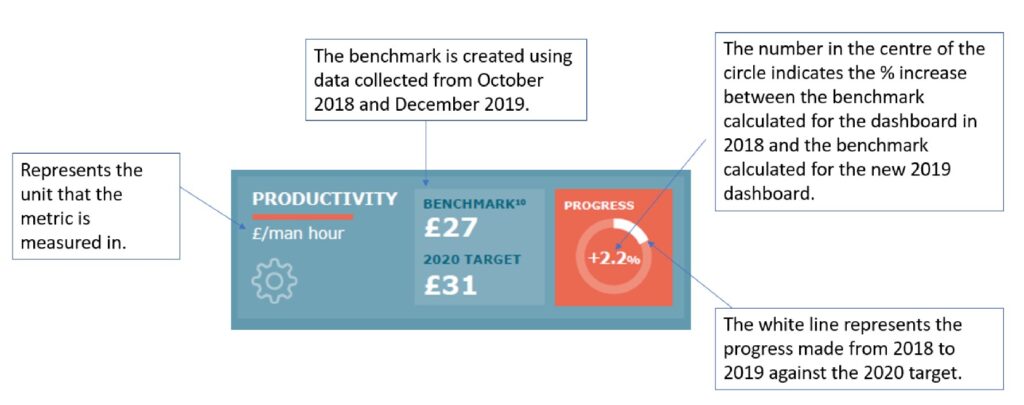
Along with each metric, there is a progress box containing a circle with a number in the middle. The number in the middle of the circle represents the % change between the 2019 benchmark figure and the 2018 benchmark figure. The circles round the outside represent the % progress towards the 2020 target, with the white line representing the % progress made. See below.
It is encouraging to see new built housing completions were rising in 2019. Based on the data set, improvements have been made across the sector with a lower number of injuries compared to the previous dashboard. Productivity has also improved for the sector. We have recalibrated the capital cost metric and the embodied carbon with new data, added prelims and the new health and wellbeing measure. Waste on site has gone up and time on site has increased in the new build homes sector, this could be for a number of reasons, including reasons like sales rate and Brexit impacts. Quality has not changed, and we are working towards a revised method in the next dashboard release.
I’m also excited to announce a new case study will be shortly available.
The housing sector is, all things being relative, at a “start point” when compared to other advanced industrialised sectors, and much more can be done to adopt innovation, deliver significant increases in productivity, satisfy end customers, and improve construction safety and wellbeing.
The CLC workgroup approach is to create demand and gain buy in for measuring project performance for the housing sector. We want to normalise performance measurement. We know the measures still need to be significantly improved, and we are working towards an improved dashboard later in 2020. Homes England, and innovative housing organisations, like Your Homes Newcastle are applying measures directly on projects, enabling their supply chain to respond to the challenges. The CLC team are determined to work with everyone to make this right, and move the sector forward.
A link to the new dashboard is here.
The Housing Industry Metrics report upon which the Dashboard it is based is linked here.